|
|
|
This thread is locked; no one can reply to it.

|
| [GCC] Separating debug symbols |
|
X-G
Member #856
December 2000
 |
For once, a question that isn't about OSX, but about Windows. I use gcc 4.4.1 (mingw) and would like to package a program for distribution. However, I want to be able to get crash reports from people if this breaks. Using exchndl.dll from DrMinGW produces a stack trace if the program crashes, which is great -- except if I don't compile with debug symbols (which would make the executable too huge), the stack trace only contains addresses and no symbols, which is nearly useless. However, as I recall, with MSVC at least it's possible to separate out the debug symbols during compilation to a separate file (the file extension for MSVC debug databases is PDB), and distribute a stripped binary as normal. Then, when you get a crash report from a user, you can recombine the PDB with the stack trace and get all the symbols back. I want to do this with gcc. However, despite extensive googling, I can't find any references to how you're supposed to do this, and the gcc manual is confusing as always. I found a reference to using objcopy to split out debug symbols, but that page seemed to insist you still had to ship the debug symbols for this to work. Obviously that's absurd and defeats the point. Any ideas? -- |
|
Thomas Fjellstrom
Member #476
June 2000
 |
Well for the computer with the crashed app to generate a full usable stack trace, you'd need them to download the debug data. If you output the stack trace in a format that leaves the function address intact, then you could process it with addr2line to grep out the function names after the fact. Or of course, capture a core dump, but those can get large. -- |
|
X-G
Member #856
December 2000
|
Dbghelp does not exist with MinGW, so I don't think I can produce a minidump... and even if I could, can gdb even handle minidumps? It is not possible for the clients to have the debug symbols available. It has to work with a stripped executable. All I have to work with are the stack frame pointers. I'll check out addr2line. EDIT: addr2line seems to work great -- it can at least give me the source file and line where the error occurs, which is fine enough for me. Cookies! Still, if anyone has any more ideas, I'd love to hear them. -- |
|
GullRaDriel
Member #3,861
September 2003
 |
X-G said: It is not possible for the clients to have the debug symbols available. I don't see how compiling with -g is a problem. I commonly leave that flag enable as the perfomance loss is not notifiable. "Code is like shit - it only smells if it is not yours" |
|
X-G
Member #856
December 2000
|
1) It makes the resulting executable nearly ten times as big (actually at my previous job we had debug symbol overhead measuring in the gigabytes) -- |
|
GullRaDriel
Member #3,861
September 2003
|
I can't post any answer ! Edit: Ha, finally yes. You should add yourself exception and dump write abilities to your app. Windows will never do it for you without any external ressource. Someone posted that, it may be usefull: 1LONG WINAPI My_UnhandledExceptionFilter(struct _EXCEPTION_POINTERS* ExceptionInfo)
2{
3 HANDLE hFile = CreateFile("FileName",
4 GENERIC_WRITE,
5 0,
6 NULL,
7 CREATE_NEW,
8 FILE_ATTRIBUTE_NORMAL,
9 NULL);
10
11 MINIDUMP_EXCEPTION_INFORMATION aMiniDumpInfo;
12 aMiniDumpInfo.ThreadId = GetCurrentThreadId();
13 aMiniDumpInfo.ExceptionPointers = ExceptionInfo;
14 aMiniDumpInfo.ClientPointers = TRUE;
15
16 MiniDumpWriteDump(GetCurrentProcess(),
17 GetCurrentProcessId(),
18 hFile,
19 (MINIDUMP_TYPE) (MiniDumpWithFullMemory|MiniDumpWithHandleData),
20 &aMiniDumpInfo,
21 NULL,
22 NULL);
23
24 CloseHandle(hFile);
25
26 return EXCEPTION_EXECUTE_HANDLER;
27}
28
29
30int main(int argc, char* argv[])
31{
32 SetUnhandledExceptionFilter(&My_UnhandledExceptionFilter);
33
34 // User code throwing exception..
35
36 return 0;
37}
"Code is like shit - it only smells if it is not yours" |
|
Thomas Fjellstrom
Member #476
June 2000
|
Maybe you can get away with just not striping symbol info? Or is that potentially confidential as well? That way addr2line may not be needed at all, the stack trace will include function names at the very least (line numbers are probably not included). -- |
|
X-G
Member #856
December 2000
|
GullRaDriel: You're missing the point. First of all you can't create minidumps with GCC because DbgHelp is not included, and secondly, even if you could, GDB cannot read and understand them. Thomas: Well the solution with addr2line does work fine for me, but: as mentioned, debug symbols can be potentially huge. I can't find any options for only generating some debug symbols and not others. And you never know, function names could be enough to figure out what is going on inside that exe. -- |
|
Arthur Kalliokoski
Second in Command
February 2005
 |
Can't you use the debugging options in some source files and not others? You may have to break them up. And if you don't mind obfuscation, you could #define the proper names to weird "real" names, i.e. #define myfunc blargh or something. They all watch too much MSNBC... they get ideas. |
|
Thomas Fjellstrom
Member #476
June 2000
|
X-G said: Thomas: Well the solution with addr2line does work fine for me, but: as mentioned, debug symbols can be potentially huge. I can't find any options for only generating some debug symbols and not others. And you never know, function names could be enough to figure out what is going on inside that exe. Right, I wasn't suggesting using -g, just not using -s or "strip". There won't be any debug info, but there will be symbol info. But I suppose it could make "hacking" easier. -- |
|
bamccaig
Member #7,536
July 2006
 |
X-G said: (actually at my previous job we had debug symbol overhead measuring in the gigabytes)
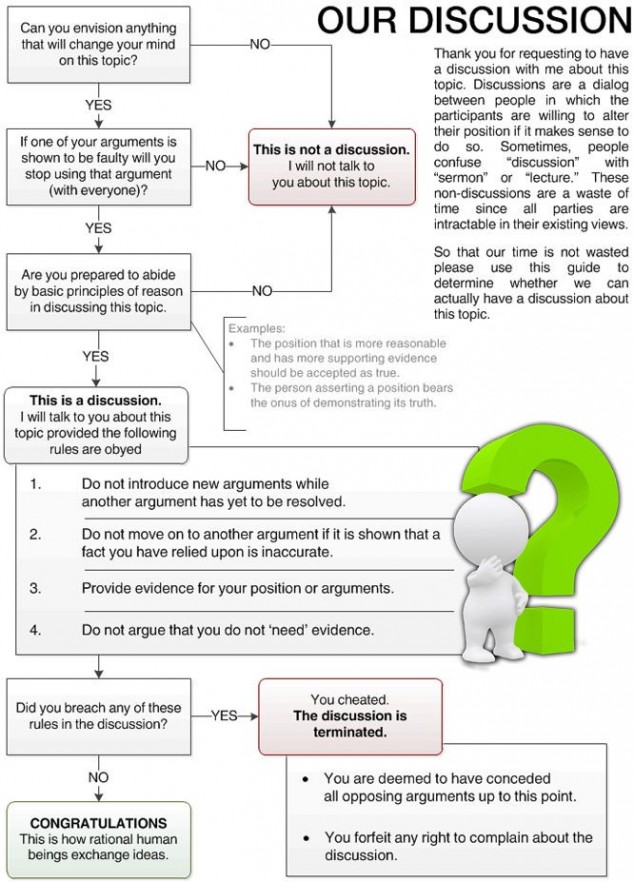
Do one thing and do it well. Not one million things. -- acc.js | al4anim - Allegro 4 Animation library | Allegro 5 VS/NuGet Guide | Allegro.cc Mockup | Allegro.cc <code> Tag | Allegro 4 Timer Example (w/ Semaphores) | Allegro 5 "Winpkg" (MSVC readme) | Bambot | Blog | C++ STL Container Flowchart | Castopulence Software | Check Return Values | Derail? | Is This A Discussion? Flow Chart | Filesystem Hierarchy Standard | Clean Code Talks - Global State and Singletons | How To Use Header Files | GNU/Linux (Debian, Fedora, Gentoo) | rot (rot13, rot47, rotN) | Streaming |
|
X-G
Member #856
December 2000
|
Please note that my previous job involved a codebase with well over a million lines of code, and heavily templated. -- |
|
GullRaDriel
Member #3,861
September 2003
|
X-G: why not using something like this ? You may like objdump too. "Code is like shit - it only smells if it is not yours" |
|
X-G
Member #856
December 2000
|
I don't think you're reading my posts, Gully. I already have a backtrace. What I don't have is debug symbols, so the backtrace just contains frame addresses and no information on what symbols those actually correspond to, and I can't ship those debug symbols to clients. Of course by now this is all an academic exercise because Thomas already found an answer that satisfies my needs. -- |
|
GullRaDriel
Member #3,861
September 2003
|
Meh. My fault, I rode the topic too quickly. "Code is like shit - it only smells if it is not yours" |
|
|

